
As we’re gearing up for election season it seems like a good time to remind everyone what unemployment statistics are and how they work. I’ve heard entirely too much uninformed discussion on the subject. First off, regardless of your party affiliation you should take a moment and realize that the economy is doing good right now. The economy is rarely doing this well, and in some sense, standard of living has never been so high in the history of the country. We should also note, the same thing happened during the Bush years. For some reason people only seem to want to believe progress is happening when their guy is in office. In general the history of the American economy has been an upwards march of awesome tempered by the occasional recession, with the large exception of the great depression.
It’s also important to remember that recessions are not a recurrence of a crappy standard of living, they’re a brief (half-year) long pause in an otherwise upward march. Usually recession means returning to a standard of living last seen a couple years prior. Some people do lose their jobs during recessions, and it is bad. Some people also lose their jobs during years when the economy is good as well. I recognize that average standard of living doesn’t mean that everyone is doing better, just that folks are doing better on average. It is important to recognize good things when they happen despite the fact that some bad things still happen.
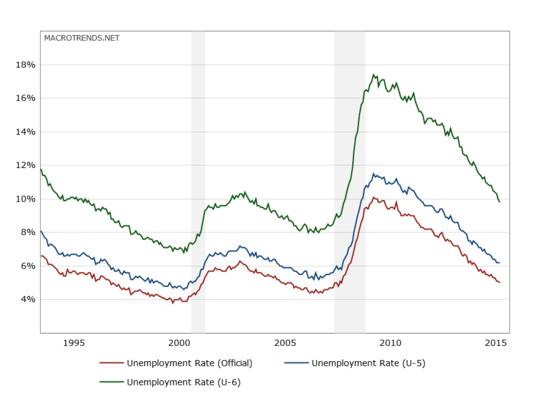
Official unemployment rate
The unemployment rate (the headline number currently at ~5%) is computed by dividing the number of unemployed folks by the number of people in the labor force (this is the number of unemployed folks + the number of employed folks). The definition of unemployed, are people who want a job, are looking for a job, and don’t have a job. This doesn’t include people who have given up looking for a job (sometimes called the “discouraged”). It also doesn’t include folks who are stuck working part time when they’d rather be working full-time.
This number has had some criticism over the years. I’ve found a really easy method of guessing the political affiliation of these critics. It’s simply the opposite of whatever party holds the white house at the moment. There is a quite simple reason for this. After a recession, the economy recovers (shocker). During a recession, however, partisans spend a lot of time claiming that the opposing party’s policies will extend the recession indefinitely, cause a depression, or simply sink into the ocean. When these claims fail to materialize (double shocker), partisans have become so invested in the story that they were telling they have to save face somehow. Therefore, rather than acknowledging that a recovery has happened, they call it a “jobless recovery” (or “precursor to inevitable catastrophe”). Since they can’t acknowledge that unemployment has gone down, they simply claim that it isn’t a good measurement by nitpicking what goes into the data. Enter the U6 unemployment rate.
U6 unemployment rate
The U6 is simply a version of the unemployment rate that also includes “discouraged” workers (people willing to say they want a job, but unwilling to take any measurable actions to get one in the last month), “marginally attached” workers (people willing to say they want a job, but haven’t had one in a long time, they have also looked for work at some point in the last year), and underemployed workers (in this case, meaning workers who work part-time but want to work full time). Naturally, since this rate includes more people on the “unemployed” end of the ratio it is always larger. A common way to use it to deceive folks is the following:
Partisan A: Clearly this president is awesome, the unemployment rate is down to 5% from 10%!
Partisan B: Well, it isn’t a true recovery. The only reason the number has gone down is that the unemployed have gotten discouraged, or got just part-time jobs rather than good full-time jobs. The recovery isn’t real. You just can’t see it because you’re in the tank for your guy. You should look at the U6 unemployment rate, it includes these extra fellows and is 10%!
The implication is that the unemployment rate hasn’t changed. That, somehow, it went from 10% to 10%. Of course you can’t compare the headline number (which is lower) to the U6. But, it’s a good way to imply that no progress has been made. If someone says something like this to you, look up the trend of the U6 rate over the last few years to get a good idea of what is actually going on.
So what do I use?
Personally I think the headline number is most useful, but it probably depends on what you’re using it for. If you’re trying to prove that your party is better at managing the economy, I’d suggest doing something more useful, like digging a big hole in your backyard. When you’re done you can fill it up again. If you must, then the partisan answer to the question is U6 when it’s their fault, and the headline number when it’s our fault.
Unemployment sucks
If you do find yourself unemployed the important thing to remember is that you need to be taking active steps to find work. Looking for work isn’t something you do by virtue of being unemployed. It is an activity you have to literally undertake. You have to make actual phone calls, and go to actual establishments of employment. Online simply doesn’t cut it. Until you find your next job I recommend taking a look at some alternatives you might not of considered. Even making a little money helps, and it helps keep you focused. If you’ve been reading personal finance blogs like this one, you hopefully have an emergency fund or some liquidity that you can tap in the meantime. Most importantly, don’t spend your time arguing about unemployment statistics online.
Adam Woods is a physicist. His research interests include building software to run and build geomagnetic models. Adam got interested in personal finance in the great recession when it became obvious an interest was necessary.
After harassing his friends and family (and a short intervention) he took to the web where he blogs about finance, investment, politics, and economics.
Adam is currently located in Boulder, Colorado where he can generally be found hiking, biking, or running a D&D campaign. He can also be contacted at adamwoods137@gmail.com.
When you’re trying to put together a statistic that accurately represents hundreds of millions of people, it’s all but impossible. Yes, it can be done, but monthly? There are always going to be discrepancies. That’s why the official census is done only once every ten years.
True, it’s important to realize there’s a substantial +/- on these things. My frustration is that partisans always seem to assume that the error is in the direction that they’d prefer rather than random.
LOL, I feel like you are goading me to make this political.
First, an editing issue. You wrote, “It went from 10% from 10%.” I believe it is supposed to read, “from 10% to 10%.”
I agree with your basic premise that we are all human and tend toward bias no matter our party. However, you seem to infer that the data is pure. No. The bureau of labor statistics and other government agencies are regularly tweaking how important indices are measured. Sometimes they are little issues, sometimes they are giant changes. And the changes are often greatly influenced by politics. I know it isn’t employment but if inflation were measured in the same way it was in 1980 we would be looking at close to 10% inflation today. Unfortunately, both parties play this game. For unemployment, when they changed the rules again and said that someone who reads the newspaper want ads is not actively enough “looking for work” magically many, many formerly unemployed “fell out of the work force” and measured unemployment went down. They don’t make the changes retroactive so that you can see effects of the change through time.
I think a better measure of unemployment is labor force participation. It has been harder for the politicians to tamper with because it is a much more straight forward measure. Unlike unemployment we aren’t deciding how much effort an unemployed person has to put in. It is also a less used measure and since it isn’t making headlines its kinda below the politicians radar– another reason it is less messed with. It very clearly shows a mild syncline wave from 1990 through 2008. Fairly steady. Then a crash from 66% to less than 63% to now. Two things of importance to note. There is no recovery in this stat. It has headed down and stayed down. And a drop from 66% to 3% of the whole US population. Some of that is baby boomer retirement, some is people living longer. But it definitely does not show a recovery in employment.
Both parties lie, cheat and steal. But, there seems to have been a fundamental shift in employment. Whether people want to work or not, whether there are enough jobs available or not are both good questions. As you mention it depends on what you are using the data for. Truly headline unemployment is best seen as DEMAND for jobs. AS THAT it isn’t a bad measure. But if you want employment, use labor force participation. Go to the BLS and plug in LFP scale it from 1970 to now. Its amazing. We have not had this few a percentage of people working since 1978! Times are tough for a lot of people.
Thanks for the editing, I’ll have to fix that!
I admit I am engaging in a little goading here =-). The trouble I have with Labor Force Participation is that I can’t see it being automatically good when it goes up. I mean, Feudal societies had basically a 100% LFP, right? The more people that can *choose* not to work under their own power, the better in my view.
It brings up another little issue that drives me crazy. When a same media outlet publishes an article bemoaning the fact that you *have* to have a dual-income household, unlike the “good old days” when only one parent had to work. Then the same outlet publishes an article bemoaning a falling LFP I want to shake them. I agree that LFP is easier to measure, but then you have to perform all kinds of demographic adjustments, to say nothing of the fact that if a person says they don’t want a job, why should we consider it a sign of a bad economy if they don’t have one?
I think the U6 adequately covers all of the objections you’ve made. (It includes that fellow who can’t be bothered to leave the house to try to get a job as a “discouraged worker”.) The U6 seems to be trending strongly down. A good test of whether your simply deceiving yourself (which is just about the easiest thing to do by accident) is to try to recall whether you were worried about the drop in LFP when the economy was recovering during the 2003 recession. It took a 1.5% hit there too and showed no signs of recovery before the 2008 crash. So if you thought the economy was great in 2006 – 2007 but is horrible now, you might be letting your bias get the better of you.
Thanks for the comment though, I sure appreciate a readership that takes the time to think these things through carefully.
Huh? I copied and pasted the above post from word and parts of it got cut. it should read…
And a drop from 66% to 3% of the whole US population.
It did it again? it isn’t posting the portion between greater than less than symbols…
And a drop from 66% to less-than 63% sounds small, but it represents greater-than 3% of the whole US population.